Maths isn’t something that is overly used in everyday web development tasks. Apart from perhaps calculating a width, height or position, there’s really not a whole lot more to it. Certainly no complex calculus or equations come into the mix, but there are a few things that you come across once in a while that can easily be forgotten if not used regularly.
The other day I rediscovered my (long) forgotten high school maths basics – specifically in relation to coordinate systems, and using these systems to graph or draw shapes on the screen. I’ll be the first to admit that I use these kinds of things so rarely that I even had to double check which axis was which. However, to complicate matters further, drawing shapes using the <polyline> tag in HTML and the related SVG coordinate system that this tag uses, the coordinate system isn’t your standard cartesian coordinate system. Without trying to get too technical, let’s take a quick look at the difference here, as I know this would have helped me a great deal just to be able to look at a reference diagram.
First, let’s have a look at what a simple SVG shape (drawn using the polyline tag) might look like:
<svg height=”75px” width=”75px”><polyline points=”0,0 0,50 50,50 50,0 0,0″ style=”fill:#ffffff;stroke:#000000;stroke-width:1px;” /></svg>
This line of code is going to end up giving you something along the lines of:

Firstly, how did we get there, and why did something so simple confuse me so much? Well, let’s first take a look at what’s happening here. SVG is a language that lets us draw two dimensional shapes vector graphics on screen. SVG defines what the graphics look like by utilising XML syntax. Thanks to HTML5, we can do this straight on our page and embed the end result easily. In the above example, I jumped in and used a polyline – any shape that is constructed using only straight lines (no curves here folks). Although the shape ended up being a perfect square, there’s definitely no requirement that this is the case. A polyline doesn’t even need to form a closed shape – but it’s certainly helpful if you’ve drawn a stroke on the object unless you want gaps in your border!
The height and width tags of the SVG container define the size of the SVG canvas. The resulting shape doesn’t have to be this big, but if it’s any bigger, you’ll lose some of it! The style tag of the polyline element follows fairly closely to the inline CSS standards, however terminology is different. We use terms such as “fill”, “stroke” and “stroke width” instead of “background”, “border” and “border-width”. All of this seems to be fairly straight forward, right? So it should be! But here’s the little catch that may (or may not) trip you up along the way when we get to the “points” element within the polyline tag…
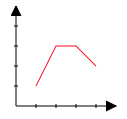
In a “normal” cartesian coordinate system, the x-axis (running left and right) starts at zero and increases as you move towards the right. Should you move towards the left beyond zero, you’ll end up with a negative x value. Similarly, the y-axis (running up and down) starts at zero and increases as you move upwards. The reverse also applies – as you go down, the value of y decreases until you reach zero where it becomes a negative value. I’ve included a little diagram (drawn in SVG just to follow the theme) to give you a visual representation of this.
Assuming that bottom left corner is zero for both axes, we’re looking at a pretty “normal” looking graphing system. In fact, if you’ve ever looked at a graph (or drawn one), you should be fairly familiar with this concept. To plot a line like this, we’d be considering the following kinds of coordinates (based on what we’ve established already): 1,1; 2,3; 3,3; 4,2. That’s the x-axis points at 1, 2, 3, and 4, and a y-axis point at 1, 3, 3 and 2.

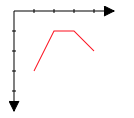
Unlike the cartesian coordinate system outlined above, the SVG system changes this and modifies the origin (0,0). This means that the whole system is flipped upside down. While the x-axis still operates as we’d expect, getting larger as you move towards the right, the y-axis starts at the top and gets larger as you move down – the complete opposite of what we saw above in the standard cartesian system.
To get started with this system, the easiest way to consider the landscape is to work from the top down. To plot a line like this, we’d be considering the following kinds of coordinates: 1,3; 2,1; 3,1; 4,2. That’s the x-axis points at 1, 2, 3, and 4, and a y-axis point at 3, 1, 1 and 2.

This flipped coordinate system was my main cause of pain when trying to work in the SVG field, and if I’d remembered this sooner, it would have much for a much less painful experience. It does seem a little unnatural because of the “reversed” nature of the coordinates, but once you get your head around this (and keep reminding yourself), it’s quite easy to achieve some pretty powerful results just with a few simple HTML tags.
After all of this, though, why on earth do we even want to be able to graph or draw like this? Well, graphing is one example, and this could be used to dynamically draw graphs on screen from data (either in the HTML code, or remotely accessed by AJAX or similar), using shapes as standalone elements or part of the design, and even to modify the standard rectangular structure of the site itself without having to use image pieces scattered all over the place.
A great example of using SVG in design is coming up really soon – as soon as it’s finalised, you’ll see it here first, and I’d love to get your thoughts on using something like this to help spice up your design and development work. Hope this helped you just a little, as I’m sure it would have me had I remembered it just a few days ago!

